Google Analytics ROAS Data
Learning how to use the model comparison tool in Google Analytics is very beneficial if you are advertising through Google Adwords and want to know what your ROI is. As an professional eCommerce SEO company, we strive to provide our clients with professional reporting by using the newest and most up to date tracking methods known to online marketeers. The model comparison tool in Google Analytics is a great reporting tool to use if you have an Ecommerce store because it will compare your spend and revenue to provide you with a return on advertising spend (ROAS). The ROAS data can be segmented down to a source, medium, campaign and many other levels so that you can see which advertising methods are most effective. With all the new features that Google Analytics has to offer, I figured it would be a good thing to write a blog post about how to use the model comparison tool. I am going to go over how to use the tool in great detail and share some of the reporting methods that we like to use here at The Miami SEO Company.
Introduction to Multi-Channel Funnel Reports
In order for the model comparison tool reports to really work you need to link your Adwords and Analytics account which is a cinch to do. You should probably also watch the short video below which gives an overview on the multi-channel funnel reports before delving into the model attribution tool. If you already know how multi-channel funnel reports work you can skip watching the video.
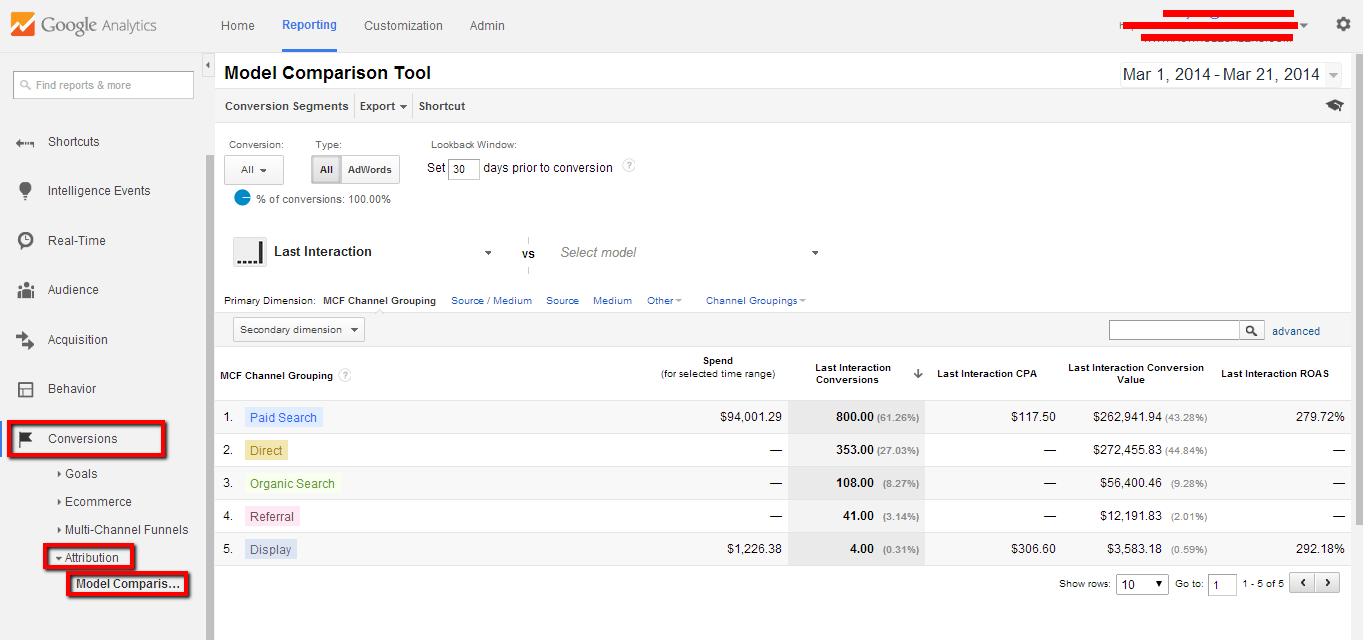
Once you have an idea of how multi-channel funnels work, you can start to rely on the model attribution tool to see actionable data as to how profitable your campaigns truly are. Assuming you’ve linked your Adwords and Analytics account lets log in to your Analytics account and drill down to the Model Comparison tool which is under the Conversions >> Attribution category on the left navigation as shown below.
Getting to Know Your Settings
Starting from the top of the page, you will see there are a few options that we have.
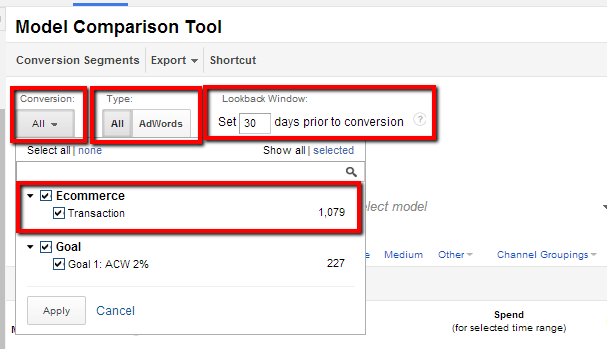
First, you can choose which types of conversions you want to use if you have many setup, in this case we are going to be looking at eCommerce transactions. So if you don’t have your eCommerce tracking enabled you will need to set that up first.
Next, you can see that there is a button for “All” and “Adwords” which allows you to segment out only Adwords data if you are only interested in seeing Adwords data. In this example we are going to look at Bing and Adwords data so we will leave “All” selected as the default type option.
Last but not least, you can choose to set the look back window which allows you to specify the cookie expiration date range. If you set the look back window to 15 days then only visitors who interacted with your site for the first time within the last 15 days will be included. This is a great feature because we all know that most eCommerce transactions require more than one visit as shoppers usually like to shop around and compare pricing.
Understanding The Different Models
If you look at the top of the model comparison tool reports, you will notice that there is a little icon that has three dots followed by a line break (…|) followed by the phrase “Last Interaction”. This is the default model that is selected but you have several options to choose from which I will go over in the following paragraphs. A model is basically just a combination of rules that you specify which will dictate which interaction gets the credit and how much credit each interaction’s corresponding medium should receive.
Example scenario: So lets use a hypothetical example, if a visitor found your site using a PPC ad for the first time, then came back using a book mark (direct) and finally came back a third time via an organic search then the organic medium would receive the credit.
For example using the last interaction model would give credit to the last medium that was used before the conversion.
The Last Adwords Click attribution model is another option which would attribute the conversion data to the last Adwords click that was used before the conversion was made. If there were multiple Adwords interactions, then the last one would get the credit.
The Last Non-Direct Click attribution model will give credit to the last non-direct medium that was used which in the example would be organic.
Using the first interaction attribution model would attribute that revenue and conversion to the first medium that was used to find your site by the visitor. In the above example, the Paid medium would get the conversion attribution because it was the first medium used.
The Linear attribution model will give equal credit to all of the mediums used in the conversion path. So in the above example organic, paid and direct would share 33% of the conversion credit.
Getting familiar with your different models and reporting techniques will help you get a lot of actionable data depending on what you are trying to do. For example if you are just running a branding campaign, you may want to see the first interaction attribution model to see which campaigns are responsible for generating the initial interest in your brand or company name. With the Last click interaction analysis you can see which medium is really helping the customer finally make the purchase. You can also create custom models which is helpful if you want to create your own attribution models for certain events or goals.
Tracking Your ROI with Google Analytics
Once you have your eCommerce tracking enabled and your Adwords + Analytics accounts linked up you will be able to see ROAS (return on advertising spend) data which is essentially tracking your ROI with Google Analytics. This data is great to have because you can apply secondary dimensions like “campaign” to see which campaigns are performing better than others. This type of data can help you make educated decisions that will help you increase your campaign performance. For example, if you are selling air conditioning parts you may notice that your ROAS is much lower during the summer time, it might make sense to pause or lower your bid adjustments on any campaign that drive visitors to your website who may be interested in heaters (in states where it is not cold during this time of year).
Below is a screen shot of model comparison report with First Interaction as the model attribution model selected. I drilled down into the Paid traffic by clicking on Paid first, this way I can just see data from my Paid mediums like Bing and Adwords.
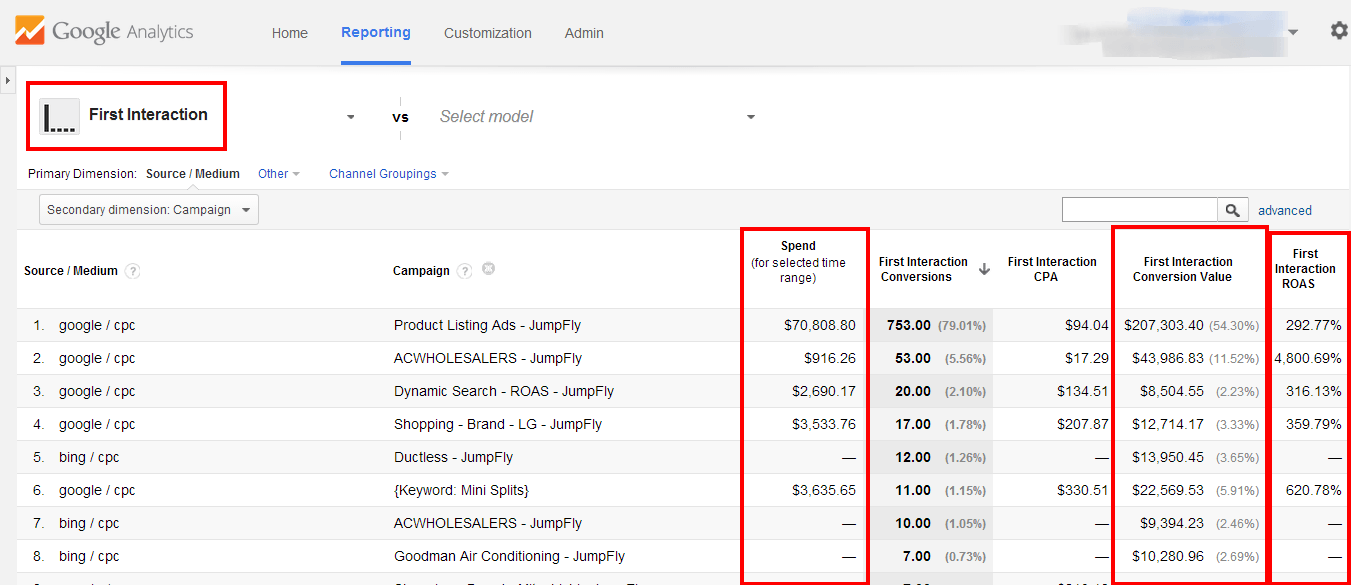
As you can see, the report is very clear and easy to understand so it is a great tool to use when reporting ROI to your clients which is exactly what we do for our clients.
About The Author

Jason Hawkins / http://www.themiamiseocompany.com
Jason Hawkins is the CEO & Co-Founder of The Miami SEO Company. He has over ten years of experience in search engine optimization, conversion rate optimization and lead generation. His core responsibilities include identifying ways to increase value of services rendered, training staff on advanced SEO topics, and A/B testing internal processes to consistently improve client return on investment.