Google Analytics Content Reports!
What are Google Analytics Content Reports?
Content is the most essential part of a website’s success for the vast majority of businesses. Because content is what ultimately drives higher rankings in the search engines and gets people interested in what you have to say and offer, it’s crucial that Webmasters continually revise and improve their content strategy and see what’s working in terms of traffic and engagement. This is where Google Analytics Content Reports come into play.
Analyzing your content reports is something you should be doing quite frequently to ensure optimum content development and strategy for your website. The key to good content development is to see what is working and what needs help, but unfortunately too many companies don’t know how to read data or understand how to move forward with changes. If this describes you, don’t sweat it. Understanding the content reports is a much easier task than it may initially seem.
Breaking Down Google Analytics Content Reports and What They Mean to You
So what are Google Analytics Content Reports? As a feature of Google Analytics, they are Site Content Reports that focus on four different aspects of your website. Once you’ve logged into your Google Analytics account, you can access these reports under Behavior > Site Content.
The four different Site Content Reports are:
- All Pages: For detailed interaction data on all pages.
- Content Drilldown: Data broken down by subfolder.
- Landing Pages: Pages on which visitors entered the site.
- Exit Pages: Pages that have been the final page of a session.
Below breaks down all of the different reports including how to read them, why they matter, what you should be looking for, how to improve, and other tips:
1. All Pages.
As a warning, the All Pages report is going to be the most involved and most overwhelming, but once you understand this report you will be able to read the others much easier. I’m going to use this report to explain all of the basics for all reports. I recommend clicking around your own All Pages report as you read about all of the different features to help make it easier.
Once you set the date range you are interested in analyzing (ex: the past week or the past month), you will find all of the pages of your website that have been viewed within this time frame. Sometimes when you run this report you will notice that there are pages missing, which can occur for two reasons: One, the page just didn’t get viewed in the time frame you set (which will likely require your looking into it further to see why the page isn’t getting any traffic), or two, the tracking code may not be installed properly (this is important, so be sure if you expected a page to appear and it didn’t that you look into this with your IT staff).
Below is a sample screenshot, which will help it make more sense. The red arrow points to the data range and where you can change it:
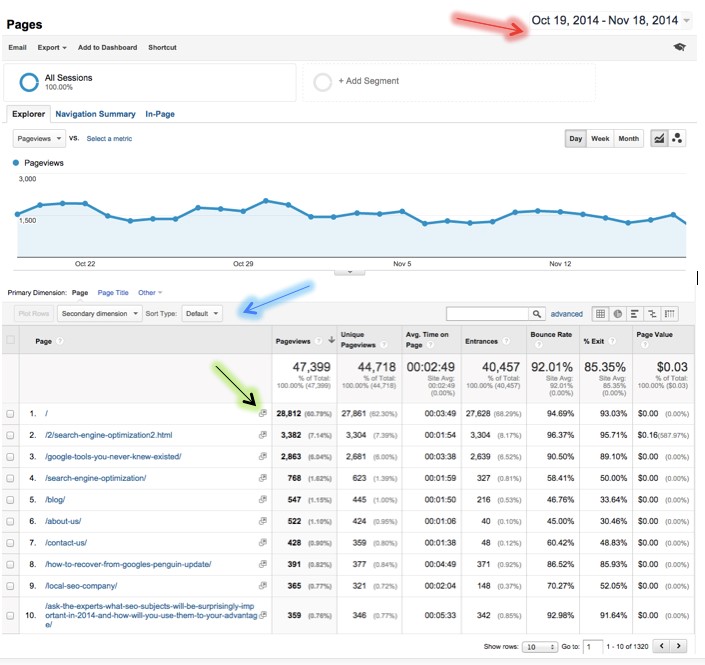
As you can see, you can view the data for each page by Page, Page Title, or Other, which includes acquisition, behavior, technology, and users, which is shown by the blue arrow. Page will give you the specific URL; while Page Title will list by whatever title you have given to the specific page. If your URLs are not clearly coded, it is recommended that you view by the title for clarity purposes.
Another aspect to consider when looking at data through Page Title is that if some pages have the same title, the data will be combined. This may alter how you filter reports to compare similar pages together, so it’s something to keep in mind.
Analyzing the Data
When viewing each URL in the All Pages report, before the data you will see a little gray square with an arrow alongside of each URL; click this arrow and a pop-up window displaying the live page on your website will appear. This is shown by the yellow arrow in the screenshot above. This feature is particularly useful for troubleshooting and identifying the pages; especially when you are working with many similar pages. Depending on the time frame you are looking at, you should consider that the page preview may not be the same version that the user saw if the content has changed.
As you might anticipate, the data displayed provides you with the level of interaction of each page within the time frame that you set. A break down of the data for each page, which you can see in the chart in the screenshot above, includes:
- Page-views: Number of times that the page was viewed.
- Unique Page-views: This takes into consideration unique sessions on your website, so that views are not duplicated.
- Avg. Time on Page: Uses the time metrics available to work out an average for the amount of time the page was viewed.
- Entrances: How many times this page was the first page from your website in a session.
- % Exit: The percentage of page-views that were the final page in a session.
- Bounce Rate: The percentage of entrances on this page where the user did not interact with the website any further.
- Page Value: This is calculated using goal values (which requires a set-up before you get started). This divides the total value by the number of page-views for this page. The Page Value data requires goals to have values against them or for e-commerce tracking to be running.
From here, you can also look at the data represented in a pie chart or bar chart. These can be particularly useful for comparison and looking at the data set as a whole, which is particularly great if you’re considering a website redesign or testing new content types.
Other All Pages analysis features
Below are a few other options you have explained quickly. I recommend visiting the links to learn more information if you’re interested.
Content Groupings
Once you set up Content Groupings you will be able to analyze the different types on content on your site against the others. This gives you aggregated data for the content within each group. Why is this beneficial? You can see if certain content you are developing is more popular (or gets more traffic) than others and adjust your strategy accordingly.
If you are interested in setting up Content Groupings you can see the Google Analytics Content Grouping help guide here.
Navigation Summary.
The Navigation Summary report displays the pages that website users were on before and after a page-view of the selected URL. Ultimately, this allows you to see how your visitors are navigating through your site as a whole. This is useful when checking goal funnels and checkout progress. In terms of troubleshooting, this will allow you to see when users were click on your site prior to experiencing a ‘404 error page.’
You can get to the navigation summary report easily by clicking the Navigation Summary tab on your All Pages report, which you can see in the screenshot above.
In-Page Reports and Analytics
This feature allows you to see a live page of your website in order to have a visual representation of page data. This can be very helpful for working out aspects like which banners work or which pages don’t need links from the menu.
This report allows for many page-specific analytics, including aspects like how many clicks were further down the page, or to break the report down by browser size, which can be useful for insuring the user experience remains strong and consistent across different sized views. Learn more about in-page analytics here.
1. Content Drilldown
The same data that can be viewed in the All Pages report is included in the content drill down, however now a sub-folder now breaks it down as well. This feature is very helpful for websites that use a consistent sub-folder structure in their URLs. This is also helpful if the site’s URLs are re-formed in order to be used for a filter. Below is a screenshot of a sample report:

In order to determine if you are looking at a page or a sub folder, you can see the images next to the dimension state. By clicking on the links, you will be re-directed to a more detailed breakdown about the sub folders or pages.
1. Landing Pages
If everything I have said so far is creating information overload in regard to analytics, it is understandable (there are a lot of aspects of website content to consider). However, this aspect is especially important. Analyzing landing pages, or which pages users entered the website on, is one of the most important things you can do to understand how your content is working for your website. This is because in order to understand your marketing strategy, you need to se where your traffic is primarily being directed. Below is a sample screenshot:
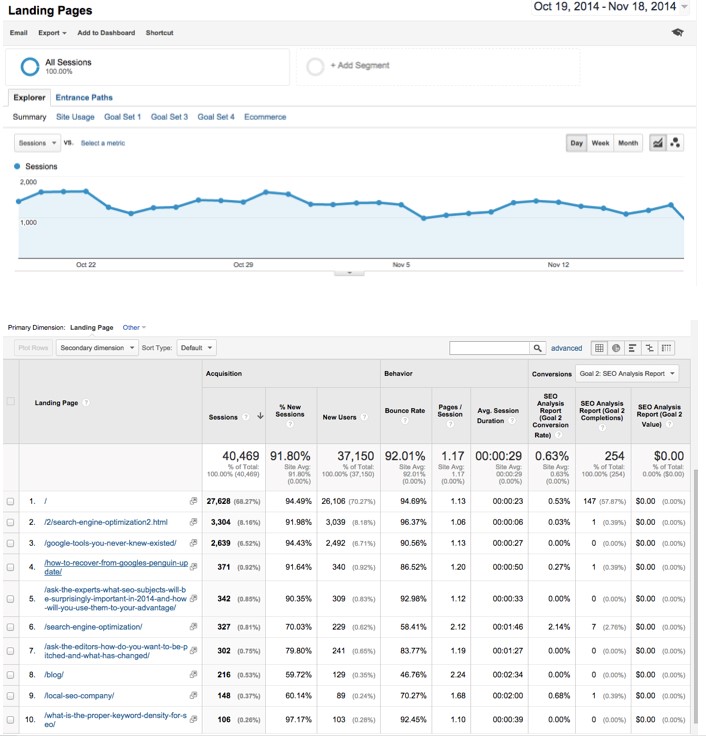
Additionally, out of all of the reports offered in Google Analytics Content Reports, Landing Pages are the only pages that show you a conversion rate (If you think about it, when a user visits your site it is likely for them to view multiple pages before a conversion happens, but there will only be one landing page). Landing Page analytics are like gold for marketing strategy because it will help you analyze where you’re really making your money and how you got people to those money-making pages as well as understand where your SEO efforts should be improved.
For those truly interested in learning more about landing pages and how to do more with them, I’d encourage you to start by reading my post on SEMRush.com which explains how I personally like to use landing page reports.
1. Exit Pages
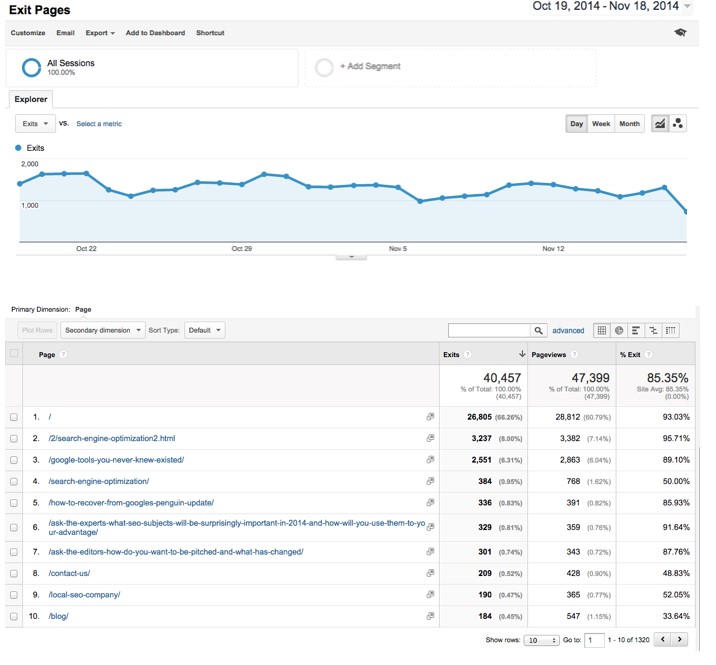
An Exit Page is the final page a user will visit on your site in a given session. If you have an e-commerce site, you will hopefully see your checkout complete page in the high rankings of this list (or a “thank you” page for your purchase type pages). You will also see pages that have higher levels of views as these are likely to lead to more exits than pages with fewer views. This is very important for looking at conversions and for assessing the overall functionality of your site. Below is a sample screenshot:
The Takeaway
These four primary tools for content analysis should put your website on track to success. The whole point of using analytics is to make sure that you are on target with your marketing, website traffic, and efforts as a whole. While there are other metrics and ways you can use Google Analytics to analyze your content, these are the four biggest reports and a great place to start. If you can identify what is working well and what isn’t, you can adjust to continue climbing the SEO ranks and ultimately drive more traffic to your website.
Do you have any advice about using Google Analytics content reports? Any questions? Let us know in the comment section below.
About The Author

Jason Hawkins / http://www.themiamiseocompany.com
Jason Hawkins is the CEO & Co-Founder of The Miami SEO Company. He has over ten years of experience in search engine optimization, conversion rate optimization and lead generation. His core responsibilities include identifying ways to increase value of services rendered, training staff on advanced SEO topics, and A/B testing internal processes to consistently improve client return on investment.