How to create custom dashboards
Everyone knows that Google Analytics is the top software to use when it comes to tracking your web marketing performance and traffic quality but not many people are utilizing all of the features it has to offer to their fullest potential. One particular feature that I feel is underutilized would be the custom reporting dashboards. I have been using them a LOT lately for our clients and it really adds a tremendous amount of value to our clients. With minimal experience, our clients can log into Google Analytics to see data directly related to the efforts that we put forth towards their marketing campaign whether its PPC conversions, SEO conversions, traffic etc. As I always say, an SEO is only as good as the tools he or she knows how to use so I feel that writing about dashboards will help any SEO that reads this post. Of course you can take things to the next level after reading this post by using advanced dashboards that include many regex filters and event labels but this post is actually intended for the “custom dashboard rookie” to learn how to do basic things like track certain landing pages or conversions from certain mediums/sources.
What is a reporting dashboard?
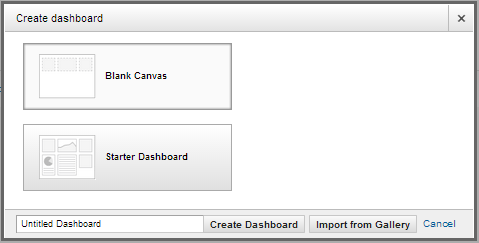
First of all, for those of you who have no idea what a custom dashboard is, simply log into your Google Analytics account and click on the Left Navigation button that reads “Dashboards”. A dashboard is a go-to place to see the data that matters most to you. If you don’t have any dashboards, you can click on “+New Dashboard” and you can either start with a blank canvas, a starter template or dashboard from the gallery by clicking on the “import from gallery” button as shown on the image to the left. I encourage you to take a look at the gallery to see the many pre-built dashboards that were designed by internet marketing Guru’s throughout the world. Google does a good job at only sharing really well put together templates in the gallery so don’t worry about finding dashboard templates that might be faulty. They all seem to work pretty darn well from my experience. Below is a screen shot of the gallery screen that allows you to perform searches for dashboards with filters and using categories or even search query.

The starter Dashboard is very basic and I don’t recommend using that option. Especially if you are trying to show your client value by making a custom reporting dashboard, this starter dashboard is really not custom at all and shows data that in my opinion is not that important. The start dashboard shows things like what locations are being used to find you on a map, the top browsers used by your visitors and the total number of new visits vs returning visitors. I really feel that the starter dashboard is there to show people what a dashboard is all about and to allow you to modify existing widgets with something to already work with.
Creating widgets to track segmented data
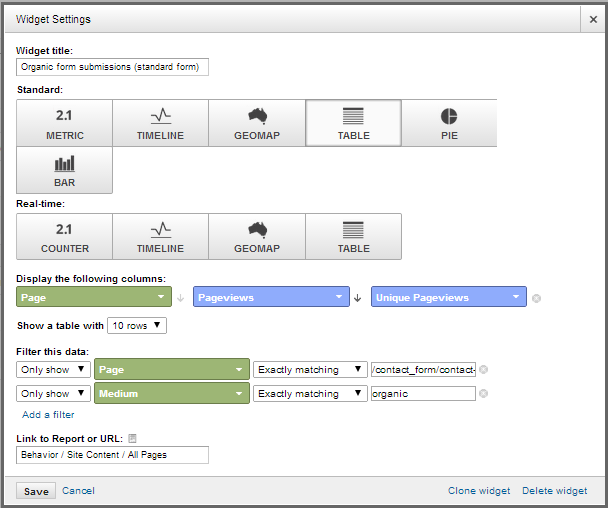
Typically form submissions and traffic are enough to measure so today I would like to explain how you can setup a dashboard to show only the data pertaining to these three things. Assuming that you or your client is interested in tracking form submissions and attributing them to either organic or PPC visitors, you may way to create widgets to show these data points in one easy to find place. For this example I am going to start with a blank canvas and my first widget is going to be used to track form submissions from PPC traffic only. To do this, you will need to either have an event that tracks form submissions or a thank you page which a visitor is directed to after filling out the form on your website that you want to track. So lets begin, first you can create a widget (click on + Widget on the top left side of the page). To the left is an example of what the widget settings window looks like. You will need to first name the widget, lets give it an appropriate naming convention like “PPC form submissions” or something similar.
I would recommend using the standard table report so you can have a clean table showing the number of PPC form submissions. To complete this, you will need to display the following columns. The first column selection which is in green as shown in the above screen shot needs to be set to “page” and the next column should show page views so that we can see the number of times the thank you page was viewed (choose unique page views as the third column to see how many unique form submissions occurred). The next thing you are going to want to do is apply a few filters. The first filter should be a “Only Show” filter which uses “Page” as the dimension and you need to set it to match a page containing or exactly matching the thank you page URL parameter which in this case is “/contact_form/contract-pan…..”. This is basically telling Google that you only want to see the number of page views for your thank you page that a visitor is directed to after filling out a form.
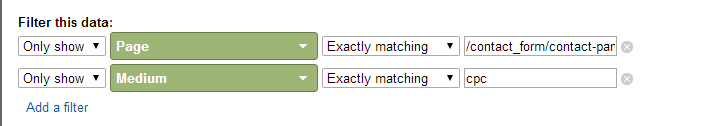
Last but not least, you will need to apply a second filter to only include organic traffic. To do so, click on “add a filter” then select “medium” as the dimension followed by exactly matching “cpc” as the field option. This is basically telling Google to only show you the number of form submissions that were generated from pay per click traffic. Below is a close up of the filter patterns that were explained.
Tracking SEO performance with custom dashboards
Assuming that you are either an SEO offering marketing services or a client paying for SEO services you should want to track the keywords and pages you are promoting. With dashboards, you can literally track the pages that you optimizing (or that your SEO company is optimizing) to see how many visitors are finding your landing pages via the keywords that you are optimizing your site for (or paying an SEO company to optimize your site for). I will explain how this can be done.
Lets say for example, you want to target one of your product specific pages that belong to your eCommerce website. We have a a lot of clients that hired us as an e-commerce seo company to help promote a few dozen product pages to the top of the SERP’s and we create dashboards that show the number of organic visits that page is getting and the keywords used to find that page. First we will need to create a widget that shows keyword data. So click on “+ Widget” and then choose the standard table report again. Next you will want to name the widget, and select the primary dimension which will be “keyword” in this case. You can select any two metrics that you want to use but I typically use new visits and visits to see how many new visits I am getting compared to repeat visits.
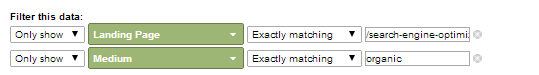
Next comes the filters, since you want to see only the traffic finding your page organically, you will need a filter to specify the page and a filter to specify the medium. So we create two just like before, one for the page that you want to track by selecting “landing page” (landing page as opposed to just “page” because we need to ensure that this page was used as an entry path organically) as the dimension and one for organic by selecting “medium” as the dimension and matching it to “organic”. Below is what the filter pattern should look like for the to “only show” filters.
Tracking keywords and landing pages in one widget
If you want to only show the visits you are getting to that particular page but you only want to show the number of visitors that found the using a list of target keywords that you are targeting you can do so pretty easily. You will need to just add a third filter which specifies which keywords to use as a “only show” filter. You will probably want to use “match regex” as your match option so that you can include many keywords in one filter. Simply separate each keyword with a line break “|” and surround the keyword list in a set of parenthesis. If you have a lot of keyword and you feel its going to take too long to manually enter each keyword I recommend you read my blog post which explains how to do this using excel formulas. I wrote a blog post a while back that shows exactly how to use Regex filters for this scenario which I encourage you to read too.
All in all, I think that this is a great place to start when it comes to creating custom dashboards. I encourage everyone to comment and ask questions about my methods and to share more advanced custom dashboard tips too! Thanks for reading!
About The Author

Jason Hawkins / http://www.themiamiseocompany.com
Jason Hawkins is the CEO & Co-Founder of The Miami SEO Company. He has over ten years of experience in search engine optimization, conversion rate optimization and lead generation. His core responsibilities include identifying ways to increase value of services rendered, training staff on advanced SEO topics, and A/B testing internal processes to consistently improve client return on investment.