Key Points of Google Analytics Dashboards
What do you think determines a good or bad website? Color scheme, pretty pictures, cool video…NO, It’s whether or not it’s making you money! How do you know if it is making you money? Google Analytics!
Revenue or New Customers is what ultimately determines a good website. Yes, user experience is important, and certainly you must have a “call to action” to monetize the visitors to customers, but there are specific metrics using Google Analytics which can help identify the performance of these areas to eliminate emotion & guesswork.
One of the easiest ways to view data in GA is to use one of the many “Dashboard” templates. These dashboards allow for pre-selected metrics in all of the key areas based on the type of website or data points you are looking to monitor. To create a new dashboard, click on “Dashboards” and select New Dashboard. This will allow you to customize your own, or, choose from the many types of templates already created for you.

I like to setup 2 Dashboards, one for measuring my Organic/Paid traffic, another looking more at my website metrics and how people are engaging on my site.
-
Standard SEO Dashboard
-
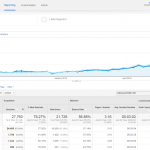
Site Performance Dashboard.
Here below is a breakdown of some specific elements of these dashboard reports every business owner should be looking at on a regular basis.
SEO Dashboard
Here are some key points of this Dashboard Report
-
Total Visits from SEO- this is all of the traffic being generated to your website from your organic efforts.
-
Non-Branded Visits- These are website visitors who were generated based on a non-brand keyword search term, ones that do not include the name of the company or brand.
-
Traffic Sources- this identifies where your website traffic is coming from’ Organic, Direct, Email, or referrals from other websites.
-
Search Engines- this segregates the traffic by all search engines, i.e. Google, Yahoo, Bing, AOL, Ask, and any others.
-
Most Viewed Pages- this is a list of the most frequently visited pages, along with the number of sessions on that page, and the average time spent on that page.
-
City Search- this displays the city of origin of the website visitors.
-
Top Keywords- these are the Top Ten keywords and keyword phrases, along with the associated time on that specific page.

Site Performance Dashboard
Some key data points on Site Performance Report
-
Number of Visitors- how much traffic are you getting each day, week, month, is it increasing month over month?
-
Bounce Rate- Are visitors leaving your pages immediately? If so, consider the type of content is there enough text, video or images to engage your audience?
-
Referrals- Are there any other websites sending you traffic.
-
Unique Visitors- How many of website visitors are actual NEW visitors? Have you launched another type of advertising campaign that might be contributing to this increase in new traffic?
-
Social Media Visits- Know if your social profiles and audience engagement is generating traffic to your site. The traffic is broken down from Facebook, LinkedIn, Pinterest, Twitter, Yelp, etc.
-
Goal Completions- you are able to track form submissions providing you have a unique “Thank You” page displayed after a form is completed and submitted from your website.
-
Average Page Load Time- this is critical, if your pages do not load quickly, especially your Home Page, you will lose visitors quickly and this is probably costing your company money.
-
Most Viewed Pages- which are your most popular pages and why is most of your traffic going there? You can learn a lot about how your visitors react to your pages? Also, the most popular pages need to have a clear call to action to convert visitors to phone calls or contact form submits.
-
Visitor Flow- What is the entry page when a visitor arrives, and what sequential pages do they visit?

Of course, just looking at the numbers is not enough, you need to segment traffic by Source, Landing Page, Browser, Mobile or Desktop, and compare date ranges from previous months or years to see any potential trends that may help you make improvements. Also you need to determine what you Key Performance Indicators are (KPI), each business is different, it could be number of new site visits, number of newsletter sign ups, or just the number of phone calls generated from a specific promotion. To continue to improve on what you learn each month, here are questions you will need to answer:
-
Which traffic source is most profitable?
-
How long does it take for users to convert on my site?
-
Where do users drop out of the conversion funnel?
-
Which products/services/goals are most active?
-
What portion of my traffic is mobile, and do I have a Mobile friendly version of my website?
Using the analytic data will provide insight to help monetize visitors to customers and eliminate emotion and opinions in the decision making process. To take this a step further, try A/B split testing of your contact forms, try a Short form vs a long form, by reducing the number of “required” inputs, you may increase the number of forms submitted, this too can be tracked as a “Goal Conversion” in a separate field in the overall dashboard. It will benefit adding a “value” to this goal so you can track the ROI on these conversions.
In summary, just setting up Google Analytics is not enough and you must establish specific goals to be able to track your success. There is so much supporting information, videos, and other tutorial documents all making it easy to understand and fairly simple to setup, simplifying the data analysis process.
About The Author

Jason Hawkins / http://www.themiamiseocompany.com
Jason Hawkins is the CEO & Co-Founder of The Miami SEO Company. He has over ten years of experience in search engine optimization, conversion rate optimization and lead generation. His core responsibilities include identifying ways to increase value of services rendered, training staff on advanced SEO topics, and A/B testing internal processes to consistently improve client return on investment.